What DORA measures
- How often you push to production
- Lead time from commit to release
- Change failure rate, as a counterweight
- The health of your deployment pipeline
Ometo is built on a methodology refined across fifteen years and seven organizations. Here’s what we measure, why we measure it, and why the usual alternatives fall short.

The engineering metrics market has converged on a philosophy: measure developer output. Pull requests merged. Deployment frequency. Cycle time from commit to production. These tools answer the question “how productive is my team?” with a great deal of precision.
That’s not the question that matters.
A team can be highly productive in the short term while quietly burning out. A team that looks slow on paper might be making exactly the right calls about quality and sustainability. A team posting excellent DORA numbers might be shipping frequently while accumulating defect debt that will consume the next two quarters of capacity.
Output metrics don’t distinguish between these situations. They tell you how fast the machine is running. They don’t tell you whether the machine is healthy.
The question that actually matters is: how healthy is my team?
Every time I join a new org, I’m trying to answer two questions: what is the state of quality, and how healthy are the individual teams?
Those sound related, and they are. They’re measuring different things. Quality is about the product: how much defect debt has accumulated, how fixes are being prioritized, whether the most important bugs are actually getting worked. Team health is about execution: can these teams deliver what they say they’re going to deliver, and if not, what’s getting in their way?
I use both because either one alone tells an incomplete story. A team executing beautifully might be doing so while the product burns down around them. A relatively stable product might be maintained by a team that’s one bad quarter away from collapse. You need both pictures.
Ometo is built around exactly these two questions.
I started using the term “predictability” in 2019. I was pretty sure I was making it up.
The situation that produced it wasn’t subtle. I had just taken over an Engineering organization in rough shape. Standard metrics (velocity, cycle time, points added and removed) looked fine on paper. We were still late on things. I needed to answer why.
So I added a metric I called predictability: of the work the team committed to at the start of a sprint, how much did they actually complete? I started tracking it without knowing quite what I was looking at. Over time it became clear that this number was a leading indicator into the health of everything else.
Predictability is a ratio. Completed story points divided by committed story points, expressed as a percentage. I’ve always asked my teams to land between 85% and 115%. A little under usually means the work was close: someone was sick, a ticket carried over. A little over means the team finished what they planned and pulled in more work, which is healthy behavior. I’ve validated that range across seven organizations. It holds.
Outside that range is where it gets interesting. Significantly under means the team’s read on their own capacity is wrong in ways that will hurt you when you try to set a delivery date. Significantly over means they radically underestimated, which sounds like a good problem until you realize the rest of the company planned around the original date.
Predictability measures capacity, not content. It tracks how much the team completed versus how much they committed to, deliberately ignoring what the work actually was. Teams rarely control their own prioritization. A PM can swap work mid-sprint. A P0 can land and demand immediate attention. There are valid reasons to change what’s in a sprint. The question predictability answers is narrower: given whatever was asked of this team, did they accurately forecast how much they could handle?
DORA metrics measure your deployment pipeline, not your Engineering team. Deployment frequency tracks how often you push to production, a metric that’s gameable in ways that should be obvious to anyone who has run a team. Deploying more frequently doesn’t mean the deployments contain meaningful value. Lead time for changes goes down when you skip code review and run fewer tests, which is fine right up until your change failure rate climbs. The metrics are designed to be self-correcting against each other, and in theory that works. In practice, none of them tell you whether the team can accurately forecast its own capacity, whether it’s burning out chasing an unrealistic date, or whether a steady drip of unplanned work is quietly consuming capacity that was supposed to go somewhere else.
Predictability doesn’t answer all of those questions either. It’s the leading indicator that tells you when to start asking them.
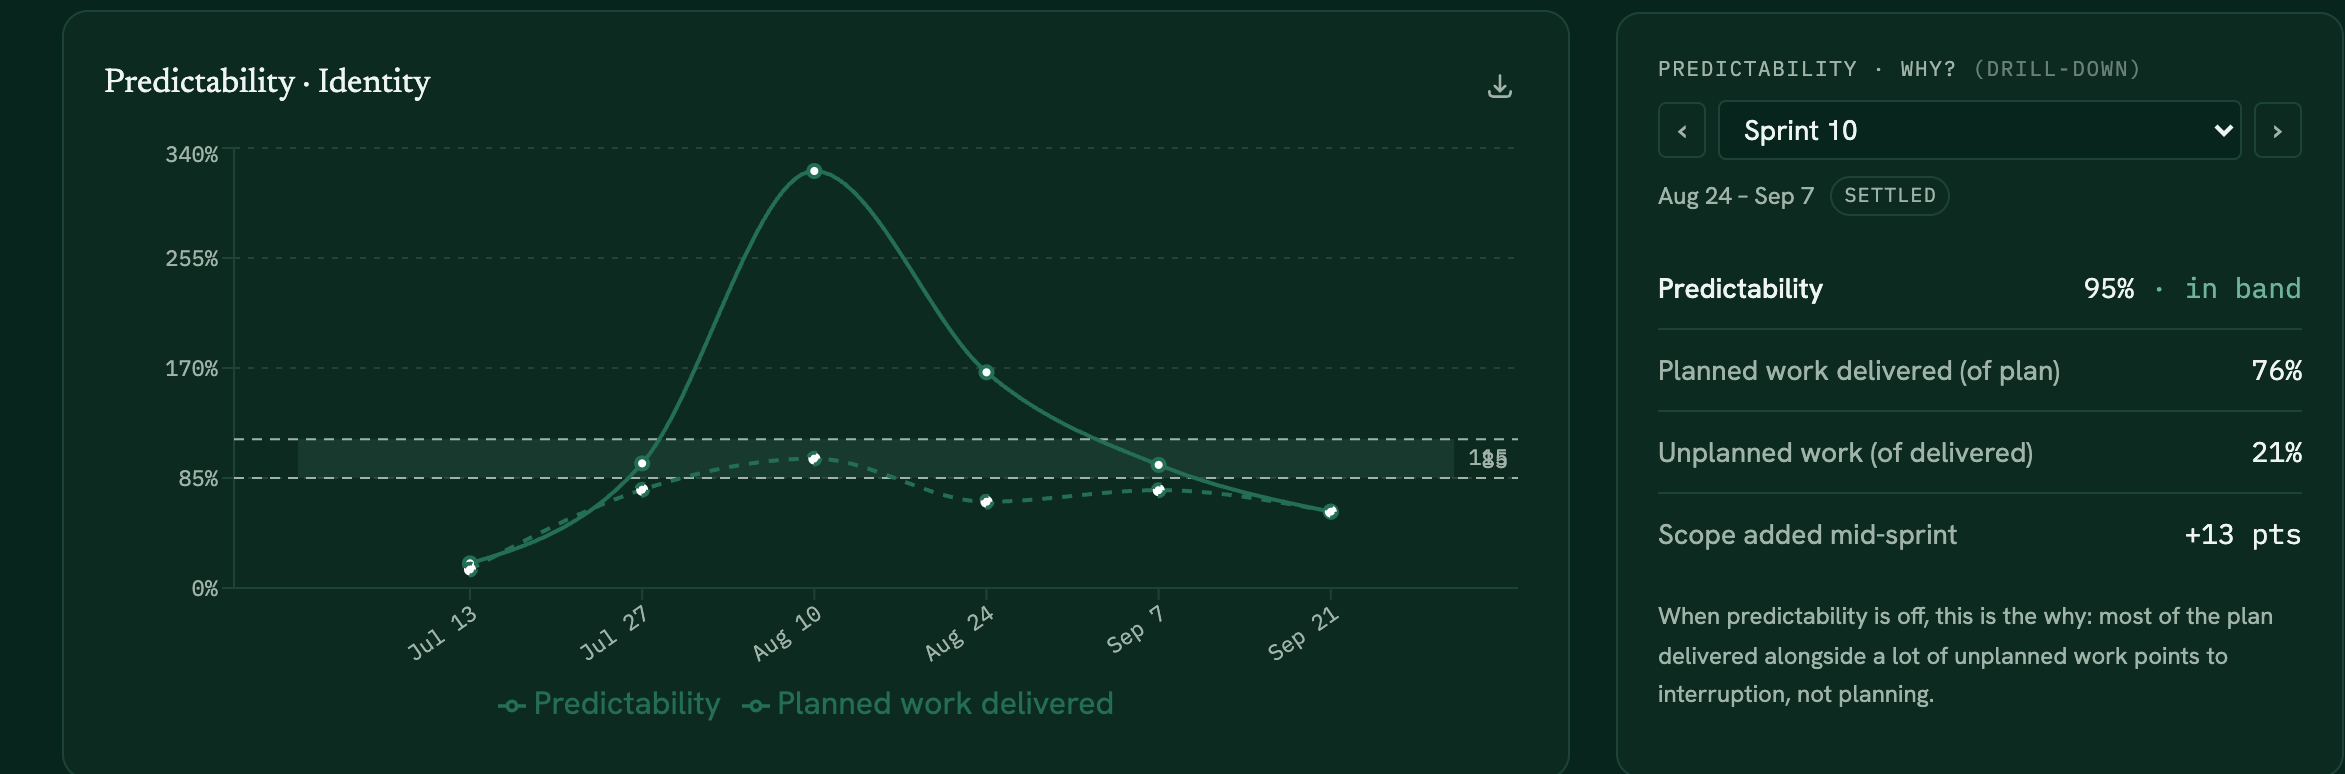
Predictability tells you whether a team is hitting its commitments. The planned/unplanned ratio tells you what kind of pressure is creating that number.
Unplanned work is not inherently bad. Sometimes a critical bug lands and you deal with it. The ratio matters. A team where 40% of completed work was unplanned has a disruption problem. That disruption is probably coming from somewhere specific. Customer escalations. An executive dropping things on the team. A quality problem generating constant reactive work. A team discovering and then prioritizing scope as the project rolls along.
I also track scope changes during the sprint: points added to and removed from active sprints after they begin. This one reveals something about organizational culture that tends to be uncomfortable to surface. Most organizations love to add work mid-sprint and hate to remove it. The implicit assumption is that the team just absorbs whatever gets added. But teams have fixed capacity, and prioritization is a hard choice. Work added without anything removed rolls into the next sprint, affects how much new work can be taken on, and compounds from there.
Watching that pattern over several sprints tells you whether the organization actually respects the team’s capacity or treats sprint planning as a rough suggestion.
For quality, I look at trends, not snapshots. How many bugs are open? How many opened this week versus resolved? What’s the net delta over time? Then I break it down by priority: what’s actually getting worked?
Which priorities are actually getting worked is the question that matters most, and it’s the one most organizations can’t answer without digging. It’s a remarkably common pattern that lower-priority issues get closed while urgent and high-priority bugs sit open for weeks. Nobody made a decision to do that. It just happens, because individuals are making judgment calls without any system enforcing priority order. Nobody is managing the queue.
Those are symptoms of the same root problem: no one is accountable for ensuring the most important things get done.
That pattern tells me several things at once: there’s no triage process, engineers are deciding on their own what to pick up, and nobody in leadership has visibility into what’s actually being worked. Those are symptoms of the same root problem: no one is accountable for ensuring the most important things get done. When that accountability is missing, it doesn’t stay contained to Engineering. Customer Support can’t close tickets. Sales runs into walls. Trust erodes between Engineering and the rest of the company.
I also pay attention to where bugs are coming from. When engineers are filing most of the bugs in a system, it usually means there’s a shadow process somewhere: a shared inbox, a spreadsheet, a separate tool that Customer Support is living in. That’s where the real backlog lives. Finding that shadow system is important, because it’s what the official numbers are missing.
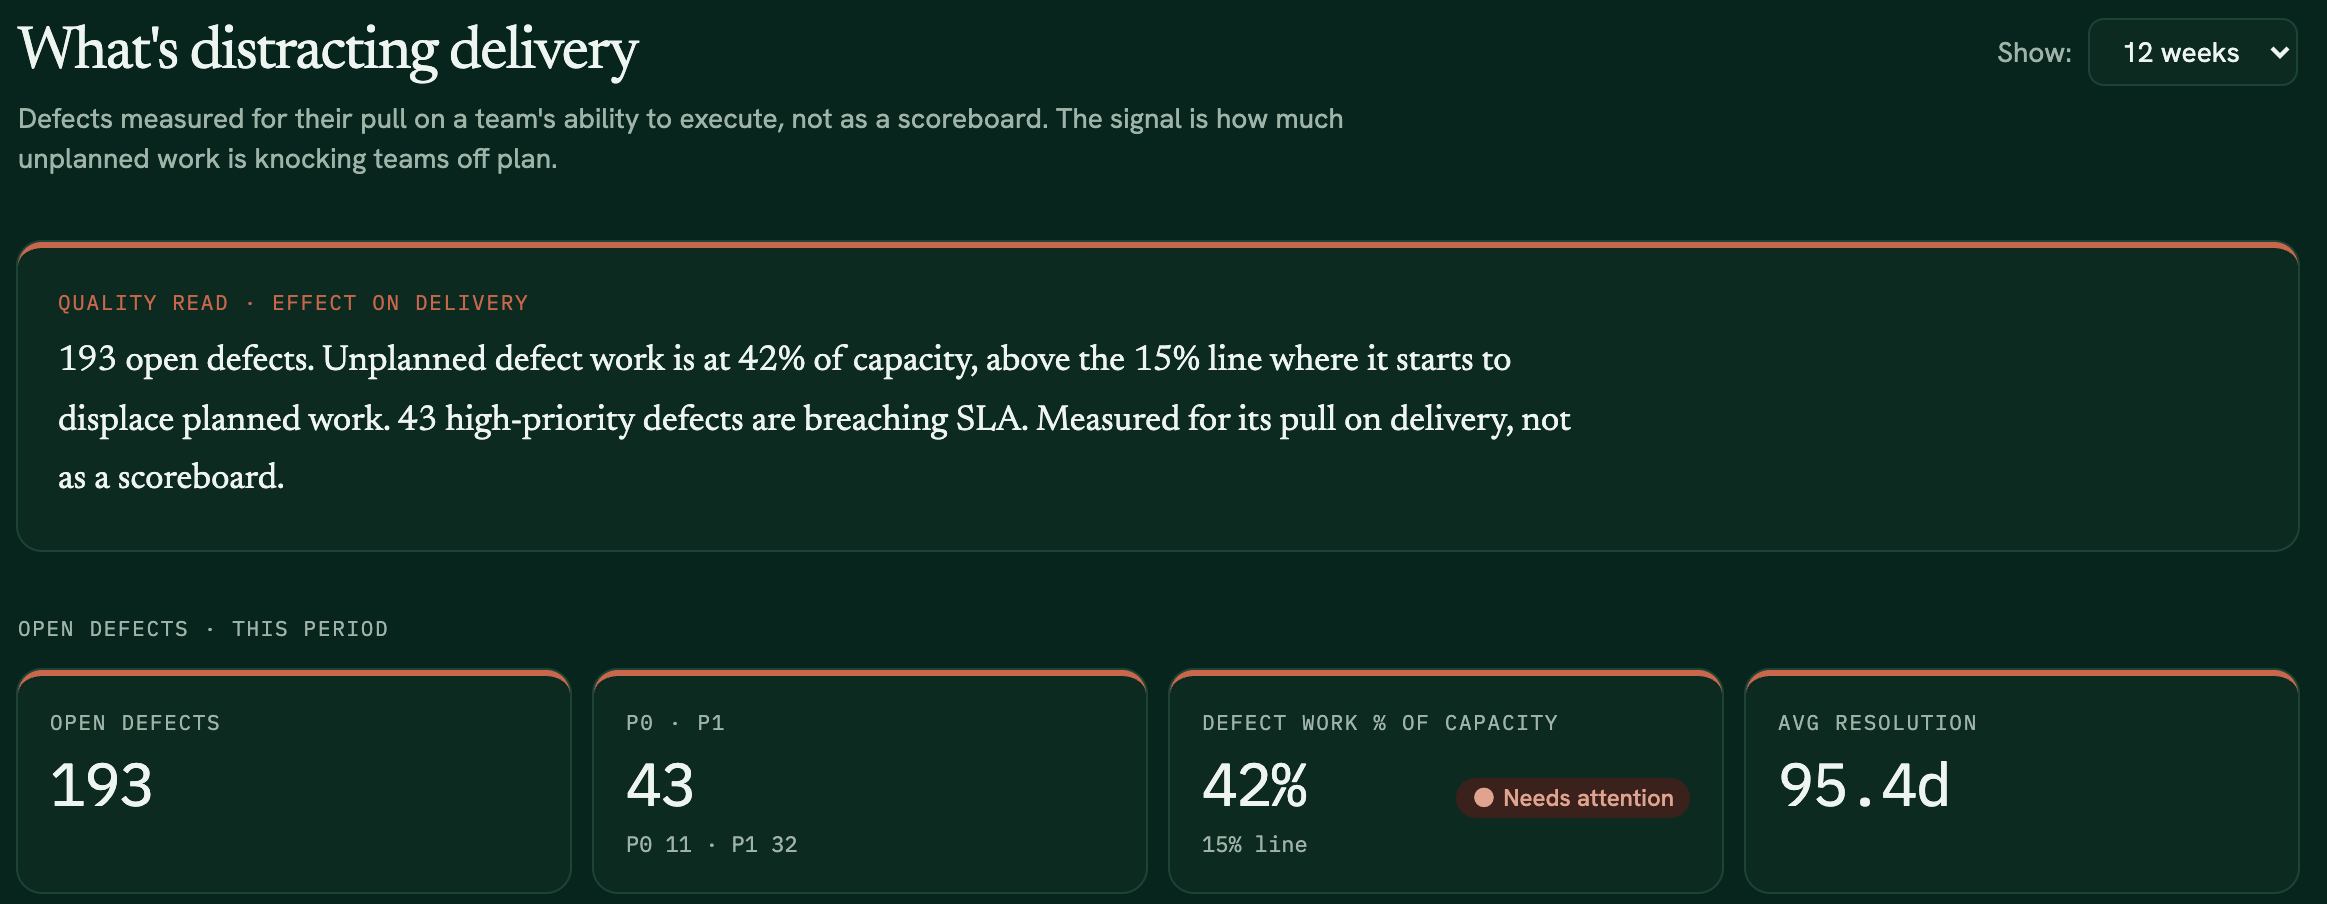
Before any sprint review dives into what individual teams shipped, I spend a few minutes on how the organization performed as a whole. Two numbers up front: organizational predictability and percentage of planned work completed. Those set the tone for everything that follows.
Organizational predictability is the aggregate of all teams’ sprint commitments versus completions. I surface this publicly because it creates a shared expectation over time. In the early sprints, I’m narrating it: here’s what we’re looking for, here’s the range we’re targeting, here’s what it means when we’re inside it versus outside it. After a few months, the company understands what they’re looking at and the number speaks for itself.
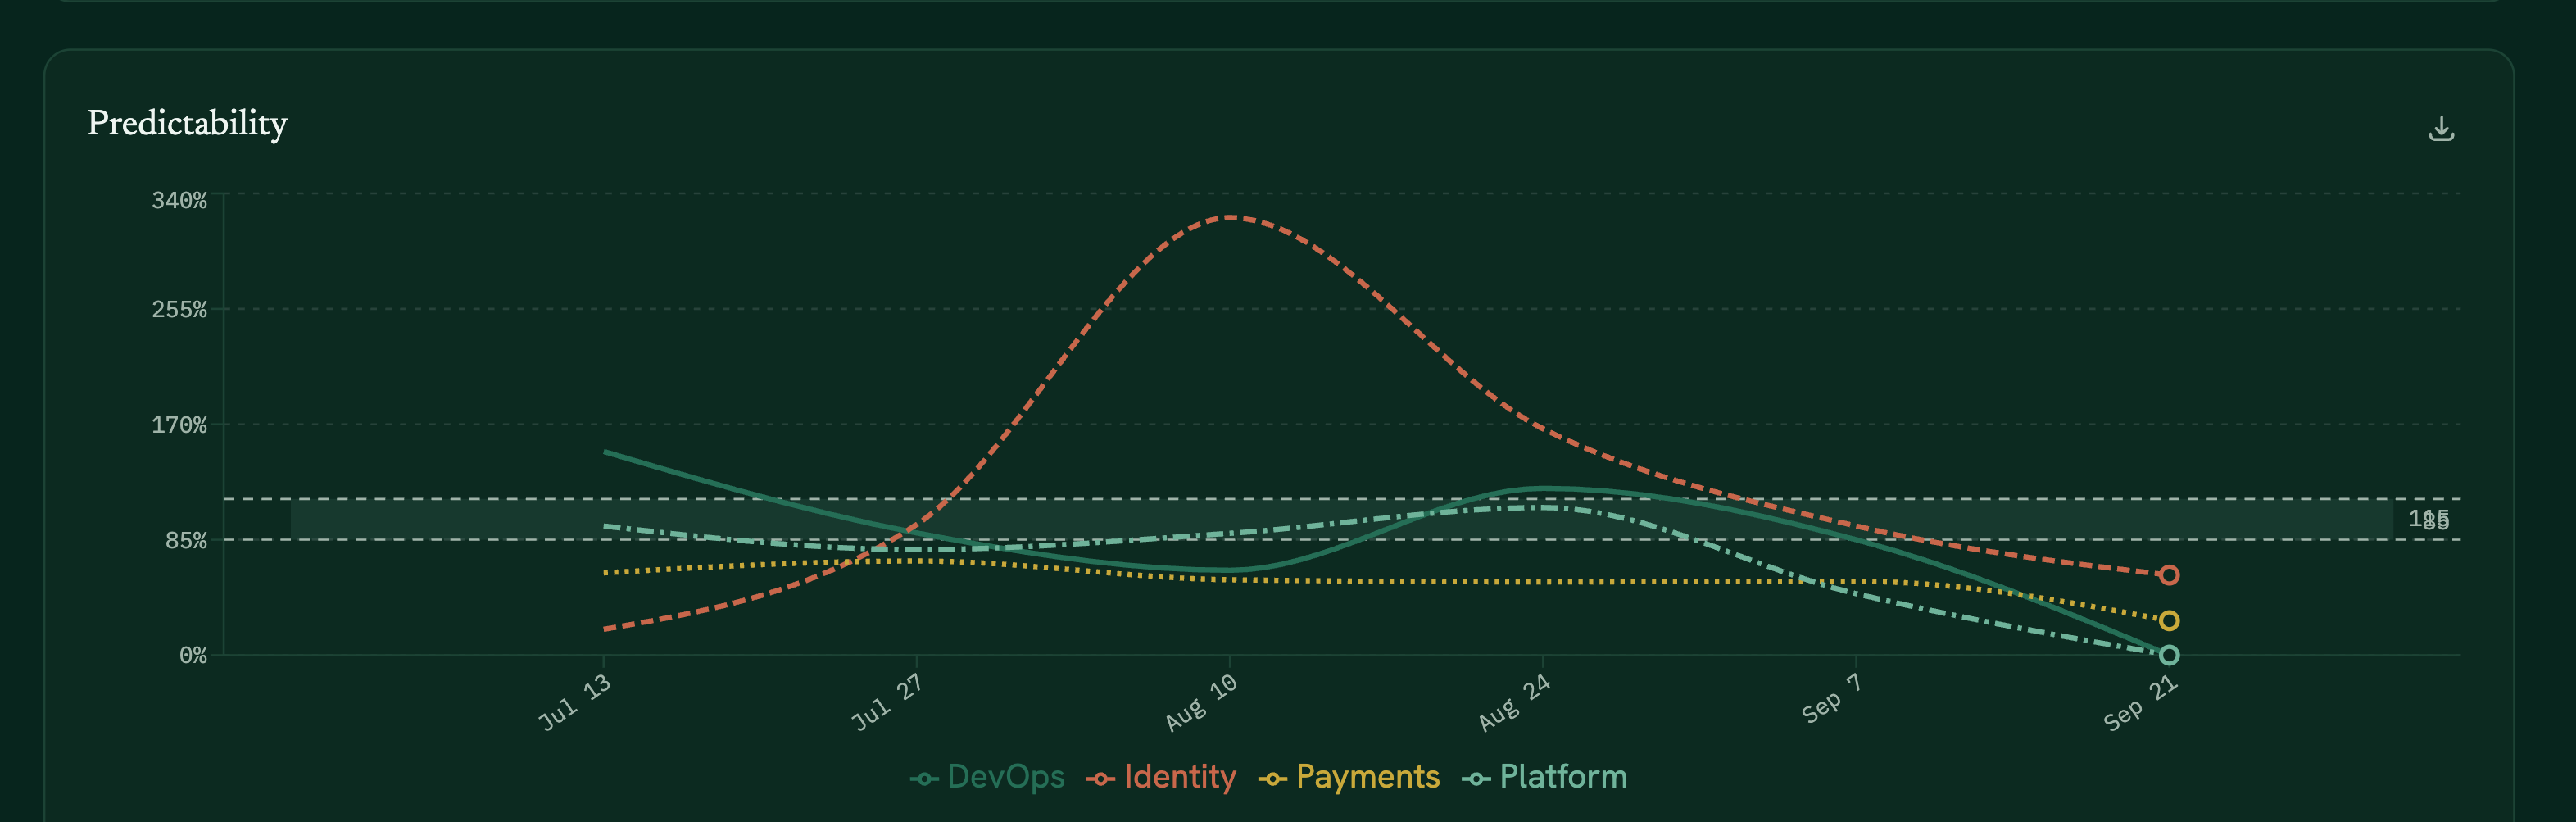
Organizational capacity is total story points completed across all teams, plotted sprint over sprint. The expectation I set is that this should be flat or trending up. The longer teams work together, the more efficient they get. So if capacity is growing, that’s a signal that things are working. When it dips, I explain why. Holidays, vacation, onboarding new hires, a system outage that consumed the sprint. Occasionally something more specific: a team got into a project and realized mid-sprint that the scoped solution wasn’t going to solve the actual problem, so they stopped and spent time re-evaluating. That’s worth naming. It’s accountability, but it’s not punitive. The team with the dip already knows. What the org view does is make the explanation visible to everyone else, so the dip doesn’t become a rumor.
I don’t break capacity down by individual team in this view. If one team’s capacity dipped while another team’s went up, the aggregate can obscure that, and that’s fine. The team with the dip knows. The subtle accountability is already happening.
After capacity, I talk about bug investment: what percentage of the organization’s capacity went toward fixing bugs in the last sprint. Every department in the company has a vested interest in knowing this, because it reflects the current investment thesis and whether Engineering is aligned to it. If we’re spending 22% of capacity on bug fixing and the bug count is declining, that’s a story worth telling. If we’re spending 15% and bugs continue to grow, that’s a different story, and other departments deserve the data to bring into executive conversations about whether the investment level needs to change.
Then I open up the quality picture: total open bugs, broken down by priority. Zero open urgents. Six open highs. Two urgents and seven highs resolved last sprint. Whether we’re fixing more than we’re bleeding. Those numbers mean different things depending on the organization’s age and size. At one organization with fifteen years of history behind it, we had 2,500 open bugs. Making a significant dent in that was unrealistic. The right move was drawing a line in the sand, deciding what to focus on, and aging out the oldest tickets that were either no longer relevant or had been quietly fixed already. For an organization that age and size, 2,500 was probably a reasonable number. An organization under five years old with fewer than 200 open bugs might be telling a different story: that Engineering has been spending too much time fixing bugs instead of building features that provide value. That’s a business question that needs to be asked on a regular basis, and the data is what makes it a real conversation instead of a feelings-based argument.
I’ve been in rooms where Customer Support was convinced the bug situation was out of control. We could show that open issues had declined sprint over sprint, that the absolute count was low for a company of that age, and that Engineering was investing 20% of its capacity making steady headway. That changed the conversation from intuition to reality. Other departments can’t advocate effectively for Engineering investment or push back on Engineering priorities if they’re working from impressions rather than numbers. The org view is how they get the numbers.
The DORA research established something important that got less attention than the four headline metrics: Westrum organizational culture type is one of the strongest predictors of software delivery performance. Generative cultures (those characterized by high cooperation, shared risk, and psychological safety) consistently outperform bureaucratic and pathological ones on every delivery metric that matters.
That finding matches what I’ve seen across fifteen years of leading Engineering organizations. When quantitative metrics show symptoms (declining predictability, rising cycle time, increasing unplanned work) the culture is often the explanation. A team in a bureaucratic culture shows different patterns than a team in a generative one, even when the surface metrics look similar. The intervention is completely different.
No competitor in this market offers culture assessment as a first-class dimension. Ometo does. A lightweight quarterly survey based on the Westrum typology (five to seven questions, under two minutes to complete) gives you a culture baseline and a trend line. When the delivery metrics shift, you can ask whether the culture shifted first.
This is the connection most Engineering organizations can’t currently make, and it’s what Ometo is being built to make. Culture assessment via the Westrum typology is on the roadmap. When it ships, it will be the first time this layer has been available alongside the delivery metrics it helps explain.
I’ve refined this diagnostic approach across a lot of organizations over a lot of years. At this point I can build the spreadsheet in my sleep. But I want to be clear about what it actually is: a tool.
The methodology gives you the right questions to ask. It gives you almost no answers. The answers come from the team. The metrics tell you where to look and what to ask about. What you do with that information requires judgment that no dashboard can supply: which conversations to have, in what order, with people you may have just met.
You can’t walk into a room with bad graphs and tell a team they’re failing. Or technically you can, but you won’t be there much longer if you do. My preferred approach is Socratic: share what the data is showing and ask what the team thinks is happening. “Your cycle time in review is notably higher than in progress. What’s your sense of why that is?” They usually know. What they didn’t have was someone asking the question and treating the answer as worth addressing.
Every design decision is evaluated against one question: does this help a leader take better care of their team?
Every design decision is evaluated against one question: does this help a leader take better care of their team? How metrics are presented, how cross-team comparisons are framed, what the AI synthesis surfaces. All of it.
Ometo connects to your Jira in minutes and starts building your team’s health picture immediately. The first sprint’s data changes how you run the next sprint review.